
CINCINNATI
REGIONAL
INDICATORS
Overview
In order to distinguish how the region is positioned nationally, this dashboard has identified comparable peer regions and measures the Cincinnati region’s successes, opportunities, and challenges based on 38 different performance indicators.
Many of the regions are similarly sized to Cincinnati, but not all. Each region has its own unique opportunities and challenges.
Over time, the Center for Research and Data will continue to add to the peer cities, including by adding more aspirational and non-geographically similar cities.


POPULATION INDICATORS
Indicators include:
Total Population
Population Growth
Working Age Population

ECONOMIC INDICATORS
Real Gross Domestic Product
Per Capita Gross Domestic Product
Fortune 500 Companies
Total Jobs
Job Growth
Labor Force Participation Rate
Regional Exports

COMMUNITY & HEALTH INDICATORS
Indicators Include:
Median Household Income
Cost of Living Index
Child Poverty Rate
Violent Crime Rate
Property Crime Rate
Educational Attainment
Degree Completions
Life Expectancy
Food Insecurity

HOUSING & MIGRATION INDICATORS
Indicators Include:
Building Permits
Net Migration
Typical Home Value
Housing Permit Change
Median Gross Rent
Housing Cost Burden

INDUSTRY INDICATORS
Indicators Include:
Tech Jobs
Tech Job Growth
Manufacturing Jobs
Manufacturing Job Growth

DEI INDICATORS
Indicators Include:
Workforce Diversity
C-Suite Diversity
Racial Income Gap
Racial Unemployment Gap
Racial Educational Attainment Gap
ABOUT THE CENTER FOR RESEARCH AND DATA
The Cincinnati Chamber’s Center for Research & Data is an initiative to deliver data-driven analysis regarding vital regional indicators and outcomes. The Center helps regional leaders, community partners, and policymakers make informed decisions around priorities like talent attraction, inclusive economic growth, and community-wide goals. We provide actionable insights to support the mission and vision of the Chamber.
For inquiries contact:
Brandon Rudd, Director [email protected]


OTHER CENTER FOR RESEARCH AND DATA REPORTS
Embracing Growth: Cincinnati Neighborhood Profiles
The second report in our Embracing Growth series on housing in the Cincinnati region presents data, analysis, and insights on population, housing, and home value growth in each of the City of Cincinnati’s 52 neighborhoods. The report includes key takeaways and findings on the City as a whole, neighborhood growth analyses by key indicators, and individual profiles of each neighborhood with summaries of the changes seen over the last decade plus.

ArtsWave Economic Impact Report
The Cincinnati Regional Chamber, in partnership with ArtsWave, recently released a report on the economic impact of the arts in the Cincinnati region. The report calculated the economic impact to be $1.6 billion over four years, illustrating the importance of the arts for our region’s economy.
State of the Region
As the region continues grow, the Cincinnati USA Regional Chamber believes it is paramount to benchmark progress and begin establishing a wide- range of key indicators that will inform business leaders and decision makers. Cincinnati’s State of the Region Report highlights areas of strength, as well as opportunities for growth.
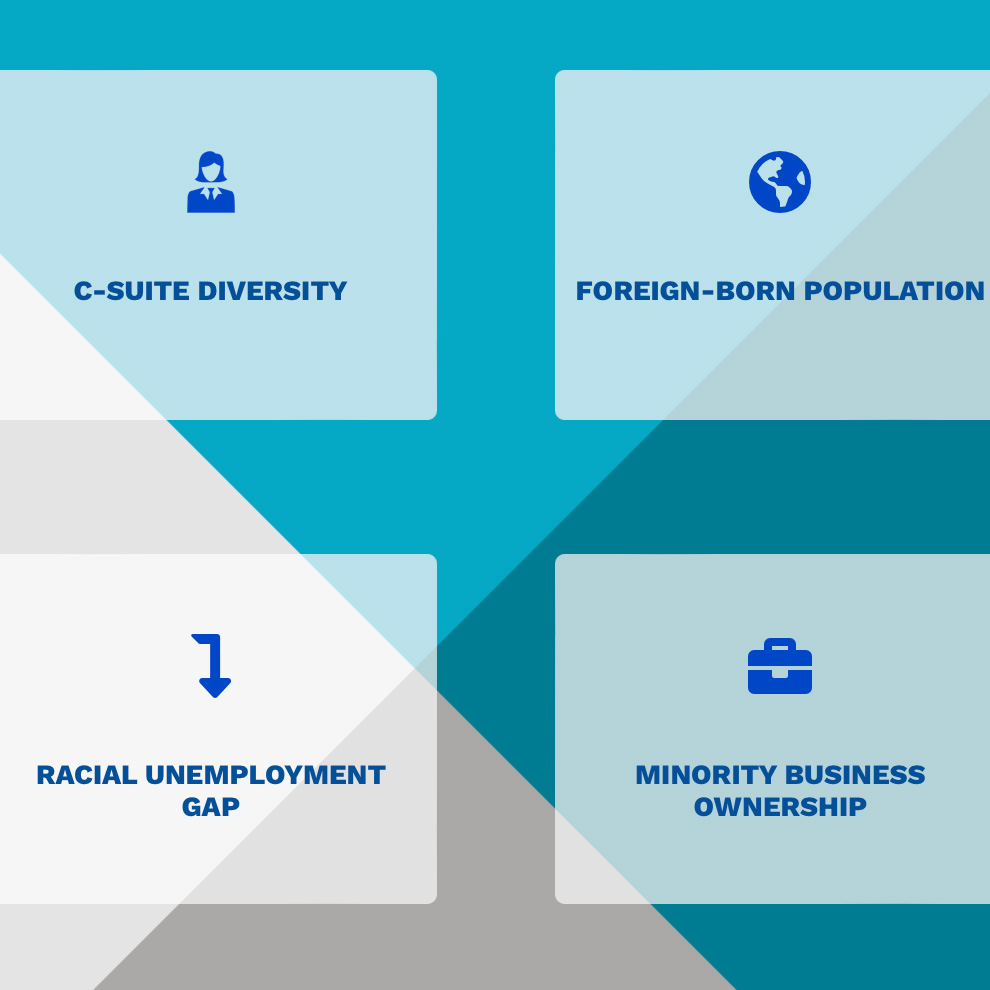
Diversity Equity & Inclusion in the Cincinnati Region
This data-driven report identifies the Cincinnati region’s positioning in diversity, equity, and inclusion compared to other peer regions. The data demonstrates areas of progress and opportunity, but also shows that the region has work to do. We hope the data will help you learn about DEI in the region and inspire you to act
BLINK Economic Impact Report
The Cincinnati USA Regional Chamber, in partnership with AGAR, the Haile Foundation, Artworks, Cincy Nice, and ish recently released a report detailing the profound economic impact BLINK®, illuminated by ArtsWave, had on the Cincinnati region.
In October 2022, the nowhere-else BLINK experience attracted over 2 million attendees across the 4-day event, resulting in a direct economic impact of $126 million dollars. Additionally, the event directly supported or created 1,687 jobs, and generated $1.5 million dollars in direct artist commissions, honorariums, and art fees.
Summer 2023 Labor Market Analysis Report
This Summer 2023 Cincinnati Region Labor Market Analysis report provides a comprehensive overview of the current labor market dynamics in our region, defined as the Cincinnati OH-KY-IN Metropolitan Statistical Area (MSA). The statistics included here are for the 16-county MSA, which is centered on the City of Cincinnati and Hamilton County – an area we refer to as the Cincinnati region.
Embracing Growth
The housing challenges the Cincinnati region faces are numerous and complex. The Cincinnati USA Regional Chamber is leaning into this effort by framing the issue broadly, with key insights from inside and outside the region, and in a way that is directly connected to the overall economic success of the entire region. We believe that the Cincinnati region has a unique opportunity to improve our regional housing stock, and this report will offer eight critical principles, backed by data, that can help our community thrive and tackle an issue that is, rightly, a top priority for so many.